

How to View Logs and Events for Your Server and Site in xCloud
Updated September 26, 2026 · 7 min read
This guide shows xCloud users and support teams how to review server and site logs, locate a failed event, open the event-details modal, copy task output, and move to the most relevant log for troubleshooting. Use Events to understand what action ran and whether it succeeded. Use Logs to inspect the continuing server or site log stream related to the failure.
Prerequisites
- Access to the xCloud team that owns the server or site.
- Permission to view the selected server or site.
- A server or site with at least one recorded event.
- A recent failure to investigate, if you want to follow the troubleshooting example.
Understand events, output, and logs
Events, task output, and raw logs answer different questions. Keep them separate while troubleshooting.
| Surface | What it shows | Use it to answer |
|---|---|---|
| Events | An activity record with the event name, initiator, time, and status | What action ran, when did it run, and did it succeed? |
| Event output | The output captured for one event, opened through View | What did that specific task report? |
| Logs | A selected server or site log stream | What did WordPress or NGINX record before, during, or after the event? |
The Copy action in Event Details copies task output. The Download and Clear controls belong to the selected raw log; they do not act on event output.
View server logs and events
-
Open the server. From the xCloud dashboard, select Servers, then select the server you want to inspect.
Expected result: The server dashboard opens with its management navigation.
-
Open server logs. Select Logs in the server navigation.
Expected result: xCloud displays the server log viewer. Select Nginx Access Log for request activity or Nginx Error Log for web-server errors.
-
Open server events. Select Events in the server navigation.
Expected result: The Events table lists recorded actions with their initiator, relative time, status, and a View action.
-
Open an event. Find the required row and select View.
Expected result: The Event Details modal opens for that event. Failed output appears in the modal when the task recorded output.
View site logs
-
Open the site. From the xCloud dashboard, select Sites, then select the site you want to inspect.
Expected result: The site dashboard opens.
-
Go to the log viewer. In the site navigation, open Site Monitoring, then select Logs.
Expected result: The site log viewer opens with a log-type selector.
-
Choose a log type. Select one of the available site logs:
- WordPress Debug Log — WordPress, plugin, or theme messages recorded by WordPress debugging.
- Nginx Log — the combined NGINX log view available for the site.
- Nginx Access Log — requests handled by NGINX.
- Nginx Error Log — NGINX configuration and request-processing errors.
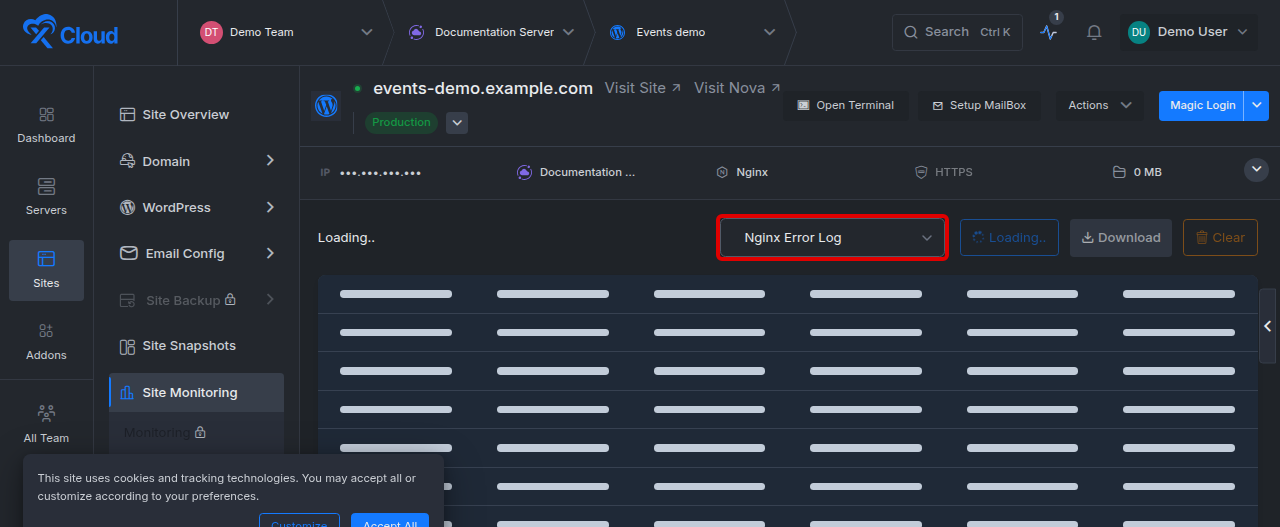
Expected result: xCloud loads the selected log. The toolbar shows the controls available for that log, including Download and Clear when applicable. If the log is empty, the controls may remain unavailable.
Investigate a failed site event
-
Open site events. In the site navigation, open Site Monitoring, then select Events.
Expected result: The Events table displays the event name, initiator, relative timestamp, status, and actions.
-
Locate a failed event. Look for the red Failed status and confirm that the event name matches the action you are investigating.
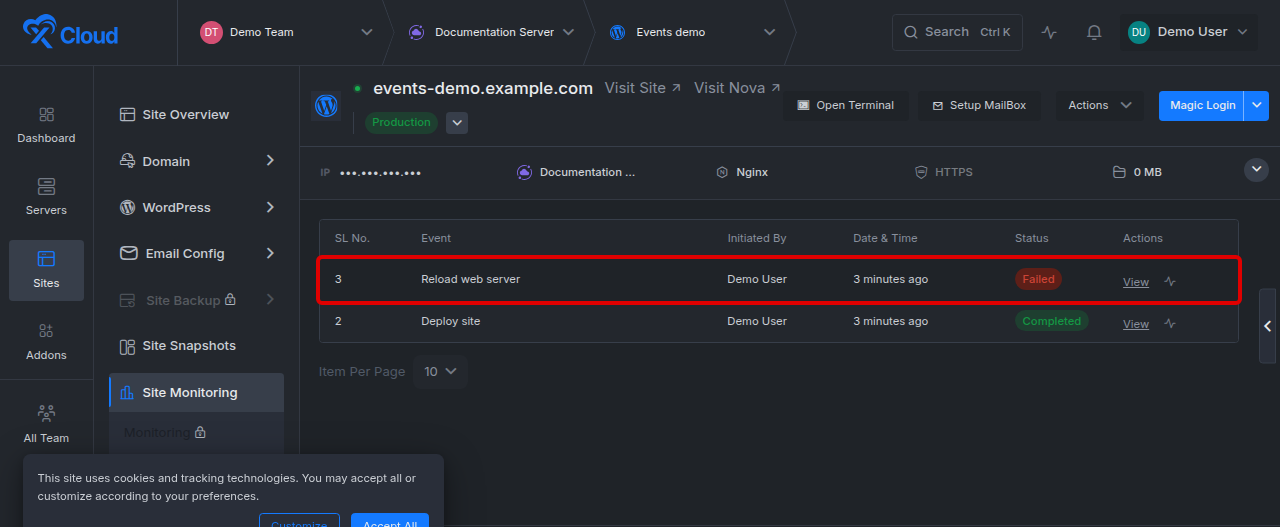
Expected result: You have identified the failed action without confusing it with a completed event. 3. Open the task output. Select View in the failed event’s row.
Expected result: Event Details opens for the selected event. The modal identifies the event and shows the number of output lines. 4. Read the failure from top to bottom. Review the final successful message, the failure message, and any suggested next step.
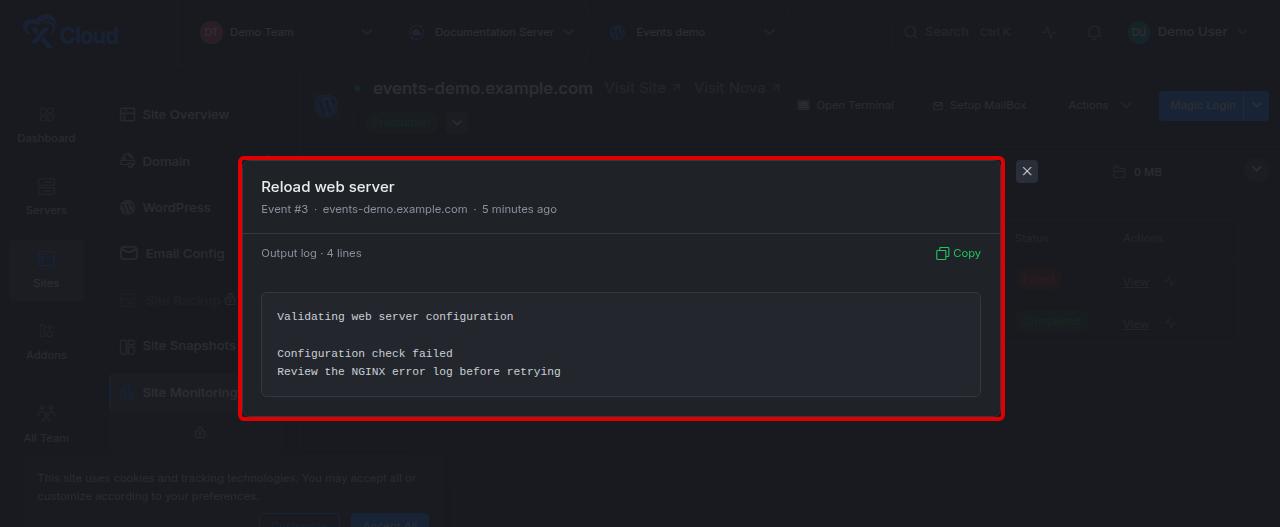
Expected result: You can identify where the task stopped and which troubleshooting surface to inspect next. 5. Copy the output when you need to share it. Select Copy in Event Details, then paste the text into your support conversation or internal incident note.
Expected result: The task output is available as text. Review it before sharing and remove any credential, token, IP address, email address, or customer identifier. 6. Open the relevant raw log. Close Event Details, open Logs, and choose the log that matches the failure. For a failed web-server configuration or reload event, begin with Nginx Error Log.
Expected result: You can correlate the event’s timestamp with the related raw log entries. 7. Correct the cause before repeating the action. Use the event output and raw log together to identify the failure, apply the appropriate correction, and then repeat the original dashboard action.
Expected result: A new event records the repeated action. Confirm that its status changes to Completed before considering the issue resolved.
Verification
You have completed the workflow when all of the following are true:
- The relevant event is visible in the server or site Events table.
- Selecting View opens the matching Event Details modal.
- The modal shows the task output or explicitly states No output available.
- For a failed web-server event, you can open Nginx Error Log and compare entries around the event time.
- After correcting and repeating the action, the new event shows Completed.
Troubleshooting
| Symptom | Likely cause | Fix |
|---|---|---|
| Event Details shows No output available | The task did not record output, or output is not available for that event | Confirm the event name, time, and status, then use the related raw log for more detail. |
| View opens a different event than expected | The wrong table row was selected | Close the modal, match the event name and status again, then select View in that exact row. |
| A selected log keeps loading or remains empty | No entries are available yet, or the selected log does not match the failure | Refresh the view, reproduce the problem if safe, and choose the log that matches the component named in the event output. |
| Download or Clear is unavailable | The selected log has not loaded, is empty, or your access does not allow the action | Wait for the log to load, confirm that it contains entries, and verify your team permissions. |
| The event failed but Nginx Error Log has no matching entry | The failure belongs to a different layer | Check the event output again. For WordPress or application-level failures, choose WordPress Debug Log or the other log named by the output. |
Common mistakes
- Treating event output as a live log. Event output belongs to one task; raw logs continue to collect component activity.
- Opening the first failed row without checking its name and time. Several failures can occur close together, so confirm both before selecting View.
- Starting with Nginx Error Log for every problem. Choose the log that matches the failing component named in Event Details.
- Clearing a log before saving evidence. Download or copy the information you need before using Clear.
- Sharing copied output without reviewing it. Remove sensitive or customer-specific data before sending output outside your team.
Frequently asked questions
Why does Event Details say “No output available”?
That message means the selected event has no recorded task output available in the modal. The event row still provides the action, time, and status; use those details to inspect the relevant raw log.
Which log should I check after a failed NGINX reload?
Start with Nginx Error Log. Match entries around the failed event’s timestamp, correct the reported configuration or runtime problem, and then repeat the original action.
Can I download event output?
The current Event Details modal provides Copy for task output. Download is a control in the raw log viewer, not in Event Details.
Next steps
- The unified Event Details modal shipped in xCloud v2.8.4
- How to troubleshoot NGINX configuration regeneration failures, the most common failed web-server event
- How to enable WP_DEBUG so the WordPress Debug Log has something to show
If an event fails and the output does not explain why, feel free to reach out to our support team with the copied output.